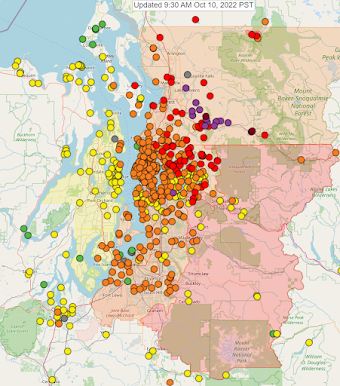
Monday Morning has started off with much of the Central Puget Sound getting wildfire smoke and having air that is UNHEALTHY FOR SENSITIVE GROUPS with some areas in the foothills well into the UNHEALTHY and some spikes of VERY UNHEALTHY. See our Sensor Map image below.
The weather pattern that gives us our awesome summer days has decided to stick around... far ... too ... long (for when we have wildfires nearby). Now, don't get me wrong, I love summer and all, but this pattern usually breaks down in September and we start getting occasional rain, or the switch flips to perm-a-rain. But this year we may be headed for a record, as others have discussed. But, we should be getting a bit of a break for the next day or two as a solid wind should start this afternoon into the evening, and push everything back to the east. The Puget Sound and western WA should have a significant improvement later today. But the switch still hasn't flipped, and we may not get that for another week...
What does this extended summer mean for our air quality and how does this compare to other years, especially the big event of 2020? One way to get a sense for this is the annual accumulation of exposure. The EPA's designated National Ambient Air Quality Standard (NAAQS) uses the annual average as a key measure of health risk from fine particles (PM2.5). So, we can look at how our exposure adds up for a whole year and approaches the NAAQS. See the figure below.

Here, we see how over the course of a year, each day adds to our cumulative exposure (or average). Each day is colored by the AQI category that we would use on a forecast for that day. [Green is GOOD, Yellow is MODERATE, orange in UNHEALTHY FOR SENSITIVE GROUPS, red is UNHEALTHY, purple is VERY UNHEALTHY] We need to keep that annual number under 12, and ideally it would be even lower. To give a general sense, I'm showing data from Marysville and North Bend. The Marysville 2020 data shows the full year, and the major wildfire smoke event is obvious with the big jump with reds and a purple. Most of the Puget Sound looked very similar to this curve. The annual average was over 10, but didn't hit 12.
By comparison, the smoke from the Bolt Creek Fire this year is more localized with the US2 corridor and the Cascades getting a much bigger hit. Marysville hasn't had as big of jump as 2020, but has been moving up faster in the last two weeks. North Bend shows one of the biggest recent increase of all of our network, but it is still below the 2020 spike. Assuming our typical PNW fall weather eventually returns, our curves will flatten out and we should still be under 10 ug/m3 for most areas. That said, some days and some places can be still be UNHEALTHY or worse for the next week or so, so people still need to be ready to take some precautions until the fires are really out for the winter.
Phil Thanks for the blog post! I love your narrative voice! Keep up the great work in helping to keep us safe and healthy.
ReplyDeleteI'm seeing a thermally induced trough on the coast being discussed in the marine forecast for Friday. With the persistent ridge, would we expect to see a significant offshore flow if that forecast holds? (In other words, are we going to see even more smoke get pushed into the Puget Sound at the end of the week?)
ReplyDeleteHi Matt, we have a chance of some easterlies most nights, so could get more smoke. The pressure gradient is fairly small and close to balanced, so it's tought to predict. I'm not seeing a major shift on Friday, though. There does look to be a low moving/building up the coast from CA that could bring a clear shift in the pressure gradient and winds on Sat. In anycase, this is far enough out that it's not a very solid forecast. But, yes, if it holds as you describe, we could see more smoke in the Puget Sound on Friday-Sat.
DeleteAre prescribed fires planned for the Cascades?
ReplyDeleteDNR's Burn Portal (https://burnportal.dnr.wa.gov/) has a map and calendar of planned large burns in the state. They have to be entered at least 1 day before ignition. Hope this helps!
DeleteThis is interesting and useful, thank you! Would love to see a future post about the 24-hour PM 2.5 standard (35 μg/m3) - what it means, how we're doing, etc.
ReplyDeleteGreat suggestion, I'll put that on the list for future post, stay tuned...
DeleteThank you Matt! Great blog. Is there any way to see similar annual accumulation charts for other sensors throughout the state?
ReplyDeleteHello! Some folks at the Dept of Ecology are working on producing more graphs! They are being individually developed and are not available on the web freely at this time. I assume they will be posted in a new blog when the graphs become available!
DeleteThank you so much for this post, its so helpful. Is there a way we can see the National Ambient Air Quality Standard information by our location?
ReplyDeleteHi, sorry I'm a little unclear as to what precisely you're interested in. Overall, the Puget Sound is under the NAAQS for everything, so every monitor we have is under the annual PM2.5 standard (12 ug/m3) and the "daily" PM2.5 standard (35 ug/m3 for the 8th worst day). We have summaries of the numbers at our Agency run monitors, in our annual report (for the Puget Sound) here: "https://pscleanair.gov/DocumentCenter/View/4828/Air-Quality-Data-Summary-2021-PDF?bidId="
DeleteOr, are you interested in the annual accumulation numbers for other monitors, or Purple Airs? We don't have that as a routine product for our Agency run monitors, yet. But we'll probably be adding that in the coming weeks. I hope this helps?
Thanks for this information! Are there any estimates as to when the smoke will be less likely to travel into the Downtown Seattle area? I thought the longer nights and cooler temperatures were supposed to shorten the distance, but the air quality is actually worse today than it has been all week, despite the cooler nights we’ve had and wind predictions. According to the local news, the fires won’t be out until October 31st at the earliest. Does that really mean practically 21 more days of smoke in the city? If so, I might need to move!
ReplyDeleteHello! Weak offshore winds will redevelop tonight and tomorrow, so unfortunately smoke will slowly filter back into Seattle the rest of this week. I think that October 31st is a bit pessimistic, we don't necessarily need the fires put out for smoke to stop impacting Seattle, we just need a return to our more normal westerly winds. Models are suggesting that the weekend of October 22-23 could be the date the pattern flips and rain returns, which would improve things almost immediately.
DeleteRight now (using unadjusted purple air numbers) we've got single digits North of the city in Everett, Snohomish, even close to Monroe; and close to single digits South of the city in Auburn and even Maple Valley.
ReplyDeleteBut Seattle, Kirkland, even Bainbridge Island are are still at least 80. Even if the numbers should be adjusted, they make clear that North and South cleared out while the center hasn't any where near as much.
There seems to be a convergence zone happening right now, and where it's happening, the smoke isn't clearing. Does the convergence zone tend to hold smoke in place?
Hey Greg! You are spot on about the convergence zone preventing effective ventilation from Seattle and Tacoma yesterday afternoon. AQ has improved quite a bit overnight, but will come back down from north to south tonight and tomorrow as weak offshore flow redevelops.
DeleteIs there a standard place to find this annual cumulative number for other locations? I realize this is exactly what I’ve been looking for but didn’t realize it existed - thanks for the great info!
ReplyDeleteHello! This is a brand new product that is being developed internally, so it is not available on the web. I believe there are some efforts ongoing to produce more graphs today.
DeleteThank you so much for this post! As usual, when a new graph is successful, people want more :) Would it be possible to add some orientation lines to the graph data? For example, I see that even with green days only, if we were to extrapolate, the yearly avg in Marysville would be around 7 and in North Bend about 2. As for the difference in the "baselines", does it come from the wind patterns in North Bend vs Marysville?
ReplyDeleteHey there! The baselines will differ based on what local sources or upwind sources of pollutants are available. Without diving too much into the data, I would imagine that Marysville sees more impact from the urban core of Seattle than North Bend does!
DeleteI'd love to see Wenatchee plotted on the graph above.
ReplyDeleteHey Adam! I believe Phil and some others at the Dept of Ecology are on it! This is a brand new product that is being developed internally, so it is not available on the web.
DeleteI was actually just thinking the same! Very interesting charting, this blog never fails to be informative.
DeleteGood morning and thanks for taking the time to respond to everyone’s comments and questions. I’m wondering how you view the various different sites that are trying to keep the public informed. I’ve been using the Canadian forecast. Any thoughts about its accuracy or the relative accuracy of the various predictions? Also, wondering if you can briefly explain why they vary so widely.
ReplyDeletePersonally, I think the Canadian FireWork smoke forecast is one of the best. There are many reasons why smoke forecast models differ in their results, but it mostly boils down to how you acquire and treat fire information. There are differences in meteorology or grid-cell size that can be influential, but that is usually minimal on a broader scale (unless you are in complex terrain). Most systems use satellite hot-spot detections to drive the forecast, and some even use official reports of fire-size. So, usually the locations of the fires are in agreement, but there are many assumptions (and uncertainty) that goes into calculating fire emissions and plume rise assumptions. Some forecasts use detailed historical fuel loading maps, assumptions of acres burned per satellite detect, and assumptions of the amount of fuel consumed (and heat released) to drive the model. Others use the heat release detected from satellite to drive the emissions/plume parameters. Another aspect is how far back you acquire fire locations for (e.g. our HYSPLIT forecast uses the detects from 10 am to midnight from yesterday, while BlueSky uses all satellite detects and reported fire locations over the past 3 days). Then there are differences in the diurnal factors used, which assigns daily assumptions to hourly emissions and plume rise. Most assume that the hottest part of the day (e.g. ~3 pm) is when fires emit most, but in reality it could be during the windiest part of the day). Furthermore, several smoke models just use dispersion, without consideration of secondary chemical formation or precipitation or even sources of smoke other than wildfire. Next, fire behavior is usually not modeled, and most assume that emissions/heat remain steady from day to day, but some models do vary future emissions based on expected meteorological influences. Finally, carryover smoke (from the previous model run), initial conditions, and boundary conditions will be different for each model; some models only consider the smoke generated from within their domain for that forecast run, others incorporate the carryover from the last run or even bring in smoke from a global model at their model domain edges. Hope this helps!
Delete