For the summer wildfire smoke season, we're bringing back the "LOCAL SMOKE OUTLOOKS" tab for our readers to quickly and easily access the custom smoke forecasts prepared by Air Resource Advisors.
Air Resource Advisors are trained to be dispatched to an incident to assist with understanding and predicting smoke impacts on the public and fire personnel. They analyze, summarize, and communicate these impacts to incident teams, air quality regulators, and the public.
Notice the new tab along the top border of the blog content area and click on "LOCAL SMOKE OUTLOOKS" to access the forecasts. Outlooks are available in English and translated into Spanish shortly thereafter.

 We're also excited to introduce another new feature to the WASmokeblog. Now, the Local Smoke Outlooks can also be accessed directly from the map.
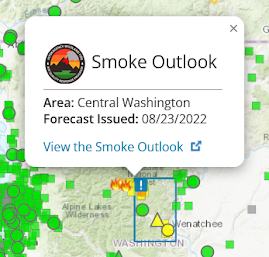
 If you see a blue box on the map, that means a smoke outlook is available for that area. Click inside the blue box, then click "View the Smoke Outlook" for local information from Airfire.org.
Interested in smoke forecasts prepared for other states?
You can find the full set of smoke outlooks prepared by Air Resource Advisors at this link: https://outlooks.airfire.org/outlook
You can find the full set of smoke outlooks prepared by Air Resource Advisors at this link: https://outlooks.airfire.org/outlook
Why is the primary map used on the blog so out of sync with my PurpleAir map? Yours shows my region of Mazama giving a PurpleAir monitor reading of 63 while going to PurpleAir itself I get somewhere between 160 and 200's depending on the scale used (e.g., US EPA or Washington Air Quality Advisory)
ReplyDeleteI suspect what you are seeing is due to averaging times. The PurpleAir site gives you the option to use an "averaging period". If you set it to 6 or 12 hours you will probably see a better match to the fire.airnow.gov map (which is what is embedded on the smoke blog page). AirNow uses what's called NowCast, which weights data over the last 12 hours, with the most recent hours more heavily weighted. You can read a little more here: https://document.airnow.gov/airnow-fire-and-smoke-map-questions-and-answers.pdf and here: https://forum.airnowtech.org/t/the-nowcast-for-pm2-5-and-pm10/172
DeleteWhile on the fire airnow or smoke blog map, click a monitor location and scroll down to the 5th item, "Historical". If you toggle between NowCast and Hourly, you can see the smoothing that NowCast creates.
DeleteAlso the raw purple air data are known to significantly over-estimate PM2.5. For more accurate readings apply the LRAPA or woodsmoke conversion factor available in the drop down menu on the upper left of the Purple Air map.
Delete